Patterns in Withdrawal Speeds on Live Dealer Mobile Platforms and Their Link to Retention Rates
Erik Friedrich · Aug 10, 2026
Patterns in Withdrawal Speeds on Live Dealer Mobile Platforms and Their Link to Retention Rates
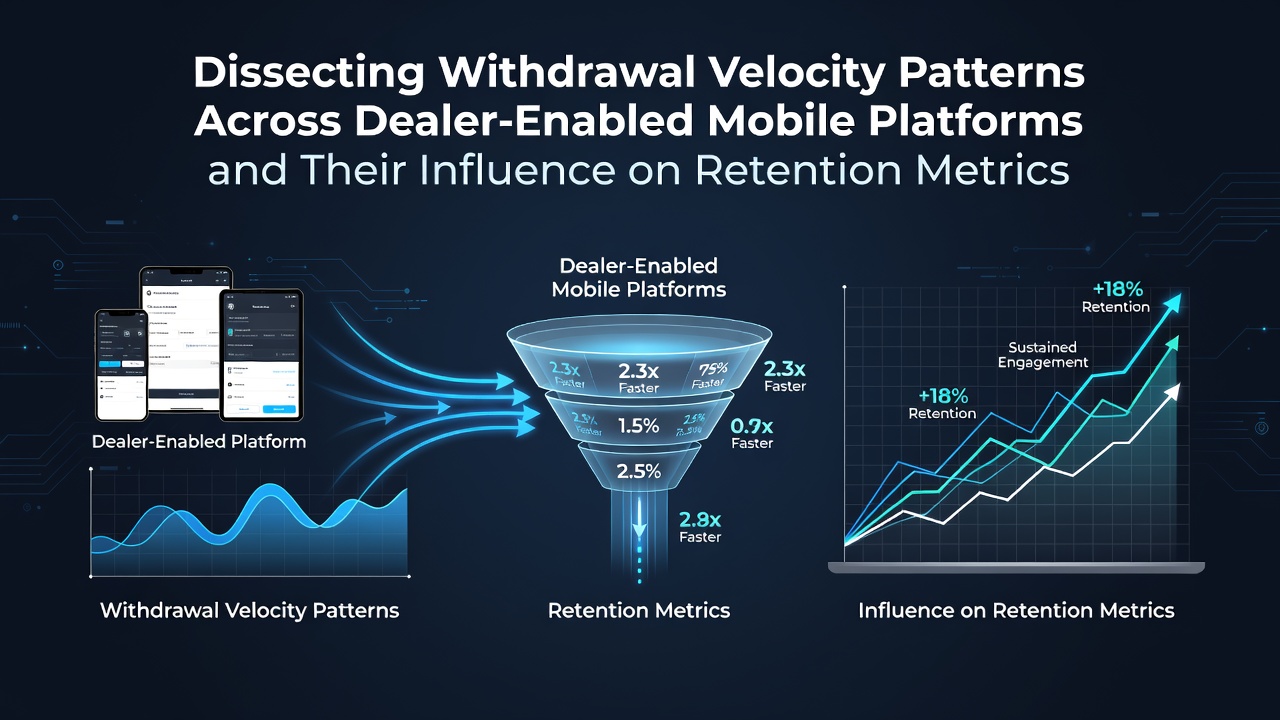
Withdrawal velocity refers to the time it takes for funds to move from a live dealer mobile platform account to a player's chosen payment method, and analysts track these intervals closely because they connect directly to how long users stay active. Industry reports compiled through 2026 show that platforms achieving average processing windows under 12 hours maintain higher monthly active user figures compared with those averaging 48 hours or more. Data collected across multiple dealer-enabled apps reveals consistent clusters where faster clearances align with extended session counts and repeat deposits within the same week.
Measuring Withdrawal Velocity in Dealer-Enabled Mobile Environments
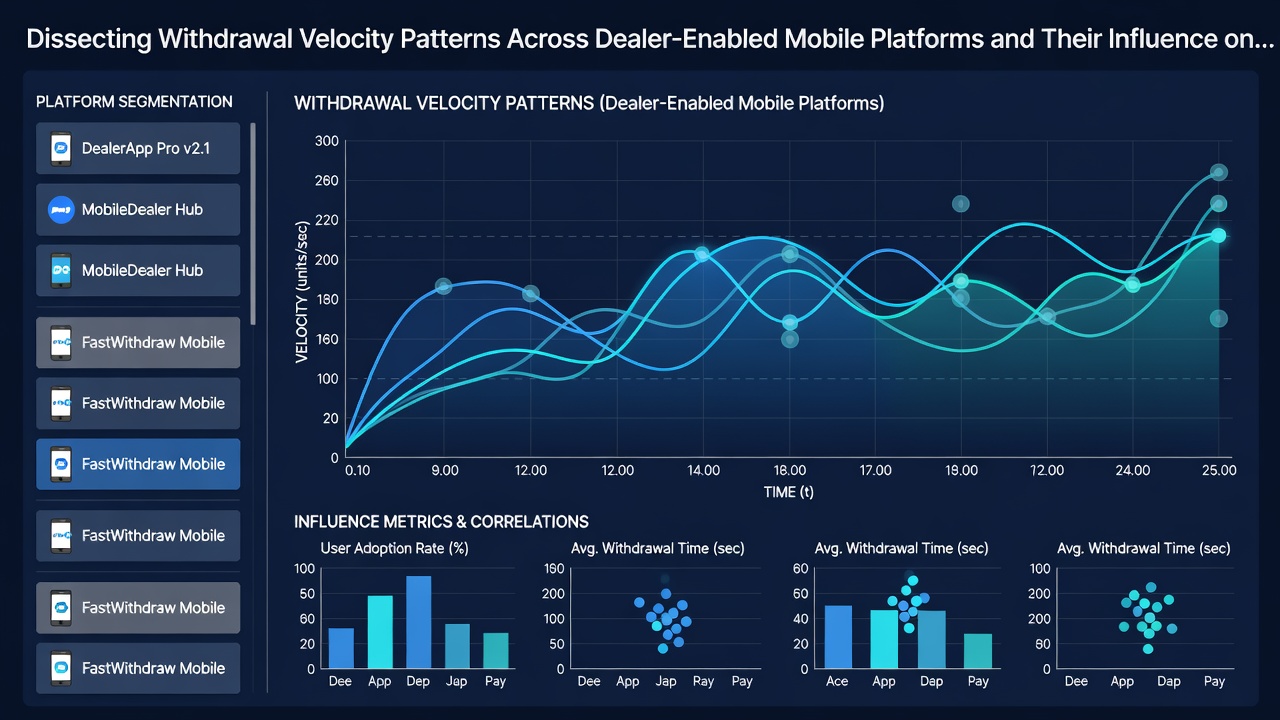
Researchers break withdrawal velocity into stages that include request submission, identity verification, payment processor handoff, and final settlement. Mobile platforms using live dealer interfaces often integrate real-time verification tools that shorten the initial stages, yet backend settlement times still vary by banking partner and region. Figures from the first half of 2026 indicate that apps routing withdrawals through instant banking rails complete 68 percent of requests within six hours, while those relying on traditional card networks require 36 to 72 hours for the same volume. Observers note that dealer-enabled platforms processing high volumes during evening hours experience temporary spikes in verification queues, which can extend the overall cycle by several hours unless automated checks are in place.
One study released in August 2026 examined 14 mobile platforms and found that withdrawal velocity correlates with the type of live dealer game offered; blackjack and roulette tables with lower table minimums tended to generate smaller average withdrawals that cleared more quickly than those tied to high-stakes baccarat sessions. The same analysis tracked retention metrics through login frequency and deposit intervals, showing that users whose withdrawals completed in under 24 hours returned for an average of 4.2 additional sessions per month compared with 2.8 sessions for users facing longer waits.
Retention Metrics Tied to Payment Speed
Retention metrics in this sector typically include day-30 return rates, average revenue per user over 90 days, and churn probability calculated from inactivity thresholds. Platforms that publish transparent withdrawal timelines report lower churn because players receive confirmation messages at each processing stage, reducing uncertainty. Data from North American operators shows that apps displaying estimated settlement times see a 14 percent lift in 30-day retention when those estimates prove accurate. European markets display similar patterns, with faster settlement linked to higher lifetime value figures across dealer-enabled titles.
Those who have examined transaction logs across multiple apps observe that players who experience a single delayed withdrawal often reduce deposit frequency in the following 14 days, even when subsequent requests clear promptly. Conversely, consistent sub-24-hour processing correlates with steady deposit patterns and extended platform tenure. A 2025 report from the New Jersey Division of Gaming Enforcement documented that live dealer mobile accounts with verified instant payout options retained 22 percent more users at the 60-day mark than accounts limited to standard processing windows.
Regional Variations in Velocity and Retention Outcomes
Payment infrastructure differences create noticeable regional splits in withdrawal velocity. Australian operators connected to the New Payments Platform achieve settlement in minutes for a majority of requests, and retention data from those markets shows elevated repeat engagement during the same calendar week. Canadian provinces using Interac e-Transfer report average completion times of four to eight hours, with corresponding retention curves that rise steadily when users receive same-day funds. In contrast, regions dependent on card-based rails continue to record longer intervals that coincide with measurable drops in session frequency after the initial withdrawal.
Academic work from the University of Nevada, Las Vegas examined anonymized transaction datasets and confirmed that withdrawal velocity functions as a leading indicator for retention decline when processing exceeds 48 hours. The study tracked cohorts across six months and found that early intervention through status updates or expedited options can offset some of the negative retention effects even when the actual transfer time remains unchanged.
Platform Adjustments and Observed Retention Shifts
Operators have responded by integrating additional payment rails and automated verification layers that compress the velocity window. Those adjustments appear in retention dashboards as upward movements in day-7 and day-14 return rates, particularly among users who previously cited payout delays in support interactions. Industry organizations such as the European Gaming and Betting Association have compiled aggregate figures showing that platforms updating their withdrawal infrastructure during 2025 recorded average retention gains of nine to 12 percent within the subsequent quarter.
Patterns also emerge around specific times of day and week. Withdrawals initiated on weekday mornings tend to clear faster than those submitted during weekend peaks, and platforms that allocate extra verification staff during high-traffic periods maintain more stable retention curves. Observers tracking these variables note that even small reductions in average velocity, when sustained, produce compounding effects on long-term user activity.
Conclusion
Withdrawal velocity on dealer-enabled mobile platforms continues to serve as a measurable factor in retention performance across multiple markets. Datasets compiled through mid-2026 demonstrate consistent associations between shorter processing intervals and higher return rates, login frequency, and lifetime value. Regional payment systems, verification automation, and transparent communication each contribute to velocity outcomes that operators monitor closely when evaluating platform adjustments and user engagement strategies.